Bitcoin just broke below the floor of its famous Rainbow Chart into the ‘BTC is dead’ zone
Key takeaways
- Some of bitcoin's most fervent holders believe the chart is signaling a key buying opportunity.
- Bitcoin trades near $62,500, down roughly 50% from its October 2025 all-time high of $126,000.
- The Rainbow Chart was developed by Reddit user Azop in 2014.
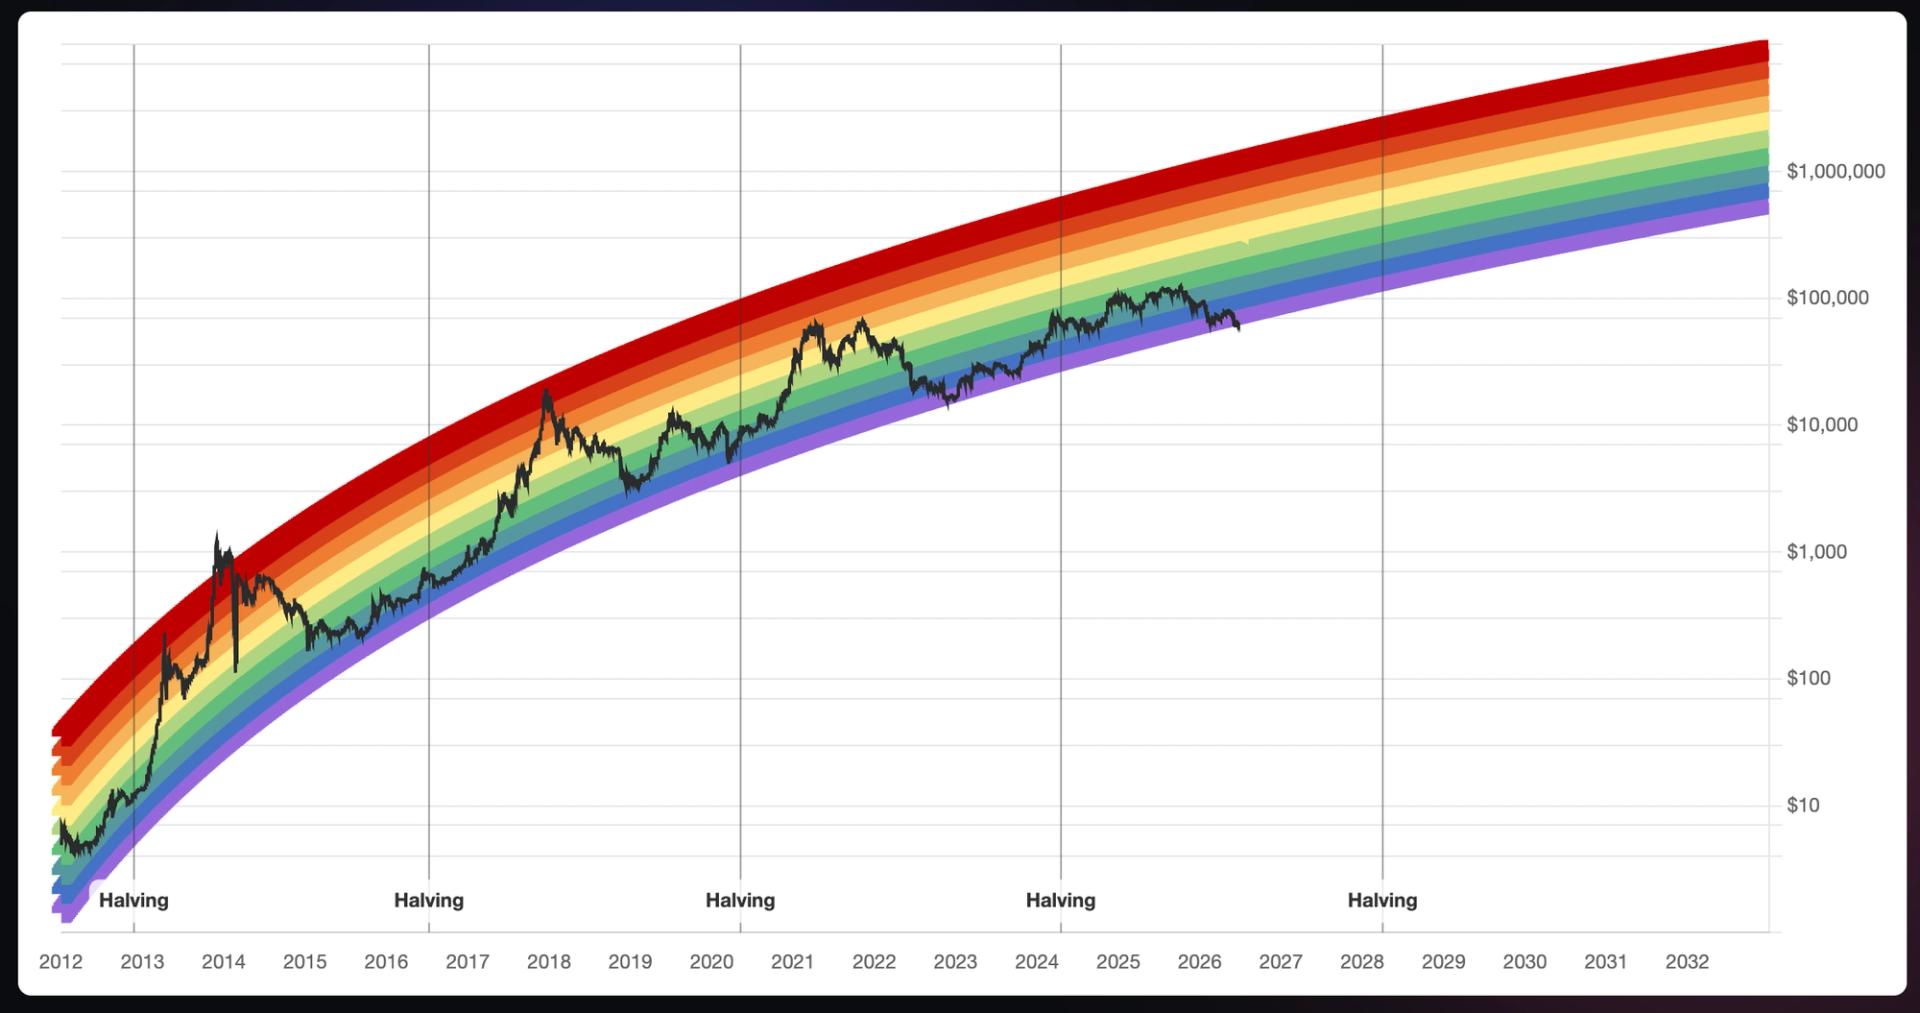
Others, view it differently. (Blockchaincenter.net)Summary Show Bitcoin has fallen below the lowest band of the long-running Bitcoin Rainbow Chart for only the second time, dropping into the original model’s “Bitcoin Is Dead” zone around $62,500.Analysts are split on whether the breach signals that bitcoin is deeply undervalued or that the Rainbow Chart itself is outdated as ETFs, institutional investors and macro forces reshape the market.Many experts now view the Rainbow Chart and similar models as sentiment gauges rather than predictive tools, noting that bitcoin’s growing maturity and liquidity have weakened the four-year boom-and-bust patterns those models were built on.Bitcoin has fallen below the lowest band of the popular Bitcoin Rainbow Chart for the second time in its history, a valuation model that has tracked BTC’s long-term price cycles for more than a decade.
Some of bitcoin's most fervent holders believe the chart is signaling a key buying opportunity. CryptoRover drew comparisons on X Wednesday with the last time it was in this zone of the rainbow in 2022, at $15,000 before a cycle bottom.
Bitcoin trades near $62,500, down roughly 50% from its October 2025 all-time high of $126,000. The decline has pushed BTC below the floor of the modern nine-band Rainbow Chart and into the original model's purple "Bitcoin Is Dead" zone, a level that has historically signaled extreme pessimism rather than a prediction about bitcoin's future.