State of the climate: Strong El Niño puts 2026 on track for second-warmest year
Why this matters: environmental and climate reporting with long-term consequences.
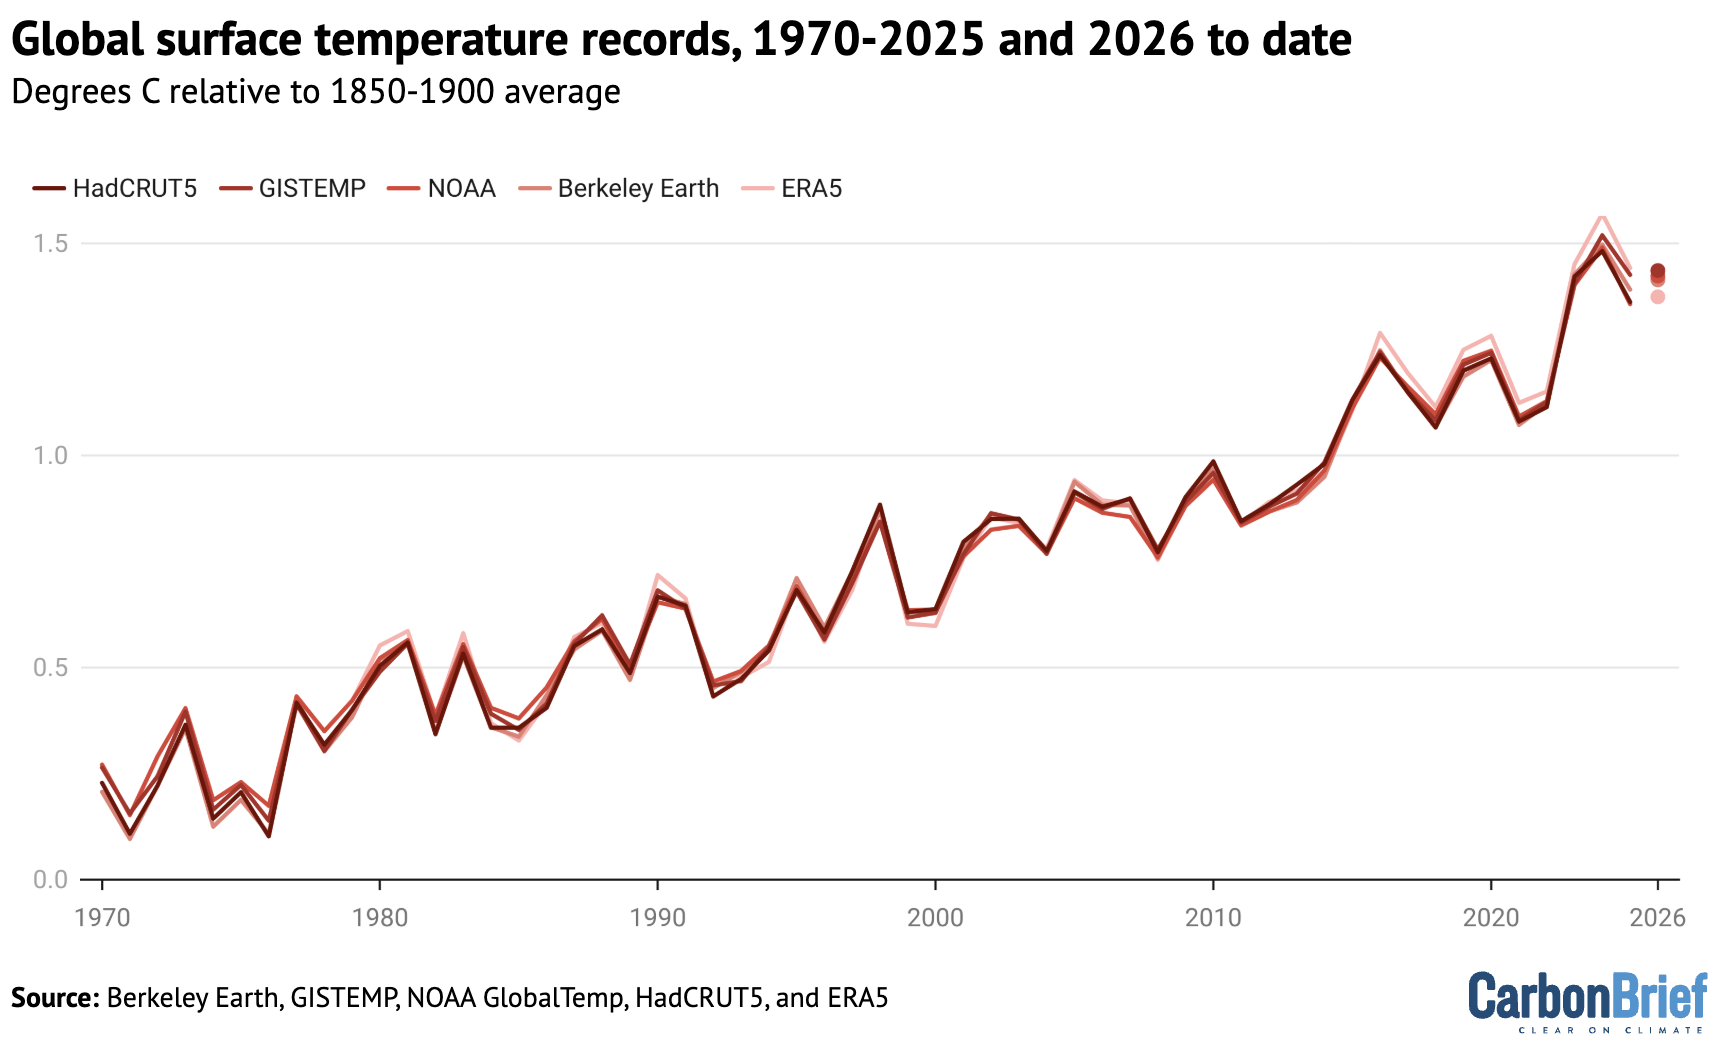
The first three months of 2026 have been the fourth warmest on record, with each successive month surpassing historical averages by a greater margin. While weak La Niña conditions pushed down temperatures at the start of the year, scientists expect the development of a strong – and potentially “super” – El Niño event by early autumn. El Niño and La Niña are the warm and cool phases of the El Niño-Southern Oscillation (ENSO), a recurring climate pattern in the tropical Pacific that shapes global weather patterns. Based on temperature datasets from five different research groups, Carbon Brief predicts that 2026 is likely to be the second-warmest year on record. The year is virtually certain to be one of the four warmest on record and, currently, has a 19% chance of surpassing 2024 as the warmest year on record. However, the development of a strong El Niño event later this year would substantially increase the chance that 2027 will be the warmest year on record. In addition to near-record warmth, the start of 2026 has seen record-low sea ice cover in the Arctic, with the year tying with 2025 for the lowest winter peak in the satellite record. Fourth-warmest start to the year In this latest quarterly state of the climate assessment, Carbon Brief analyses records from five different research groups that report global surface temperature records: NASA, NOAA, Met Office Hadley Centre/UEA, Berkeley Earth and Copernicus/ECMWF. The figure below shows the annual temperatures from each of these groups since 1970, along with the average over the first three months of 2026. Annual global average surface temperatures from NASA GISTEMP, NOAA GlobalTemp, Hadley/UEA HadCRUT5, Berkeley Earth and Copernicus/ECMWF’s ERA5 (lines), along with 2026 temperatures so far (January-March, coloured dots). Anomalies plotted with respect to the 1981-2010 period and shown relative to pre-industrial based on the average pre-industrial temperatures in the Hadley/UEA, NOAA and Berkeley datasets that e