Bitcoin price has limited downside, likely near bottom, contrarian indicator suggests
Key takeaways
- This signal has historically been a contrarian indicator, marking bear market bottoms and renewed bull runs.
- That's the conclusion from an indicator that might seem to signal a bearish shift in sentiment but has tended to presage a more bullish outlook.
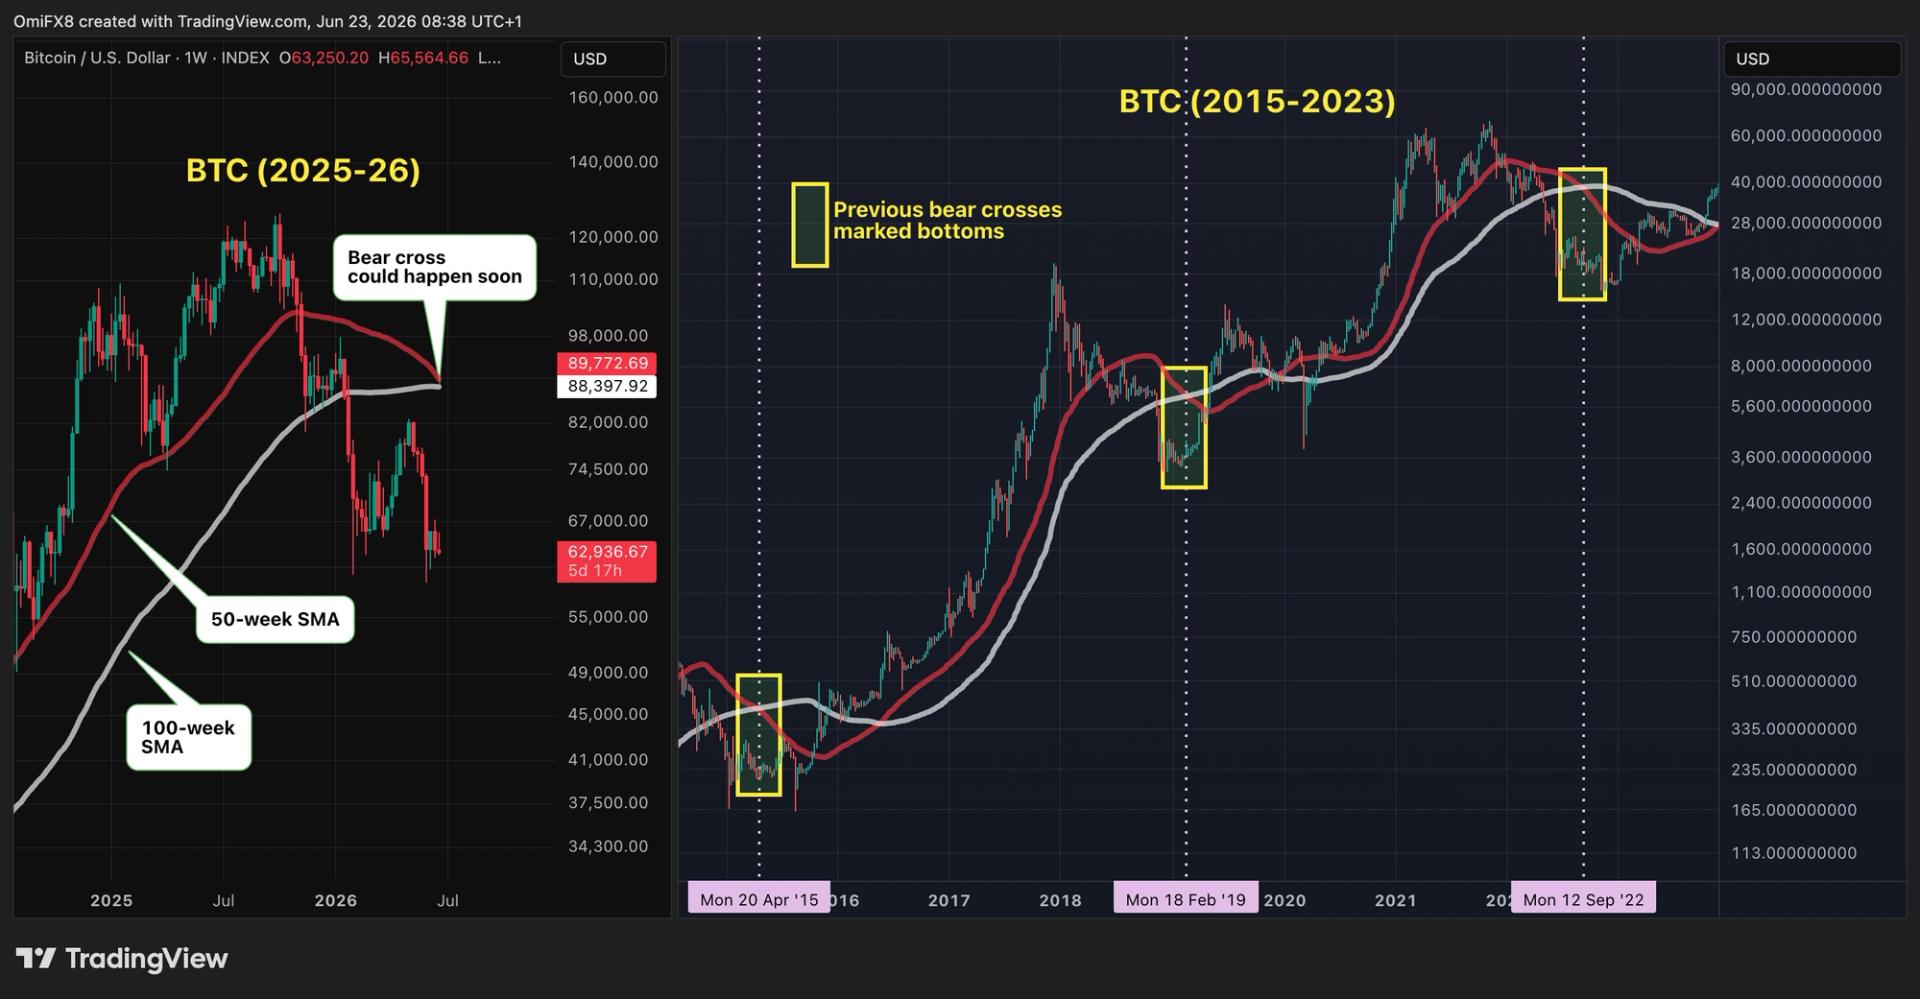
- The indicator is based on two moving averages: Bitcoin’s 50-week simple moving average (SMA) and the 100-week average.
This signal has historically been a contrarian indicator, marking bear market bottoms and renewed bull runs. If you’re wondering just how much lower bitcoin BTC$62,318.36 is likely to drop, the answer, at least according to one historically accurate contrarian indicator, is not much.
That's the conclusion from an indicator that might seem to signal a bearish shift in sentiment but has tended to presage a more bullish outlook.
The indicator is based on two moving averages: Bitcoin’s 50-week simple moving average (SMA) and the 100-week average. The 50-week average, representing roughly one year, is very close to dropping below the 100-week line. A shorter-term measure is often seen as a more accurate reflection of recent attitudes, so the cross would trigger what analysts call a "bear cross." At current trajectories, it could happen as soon as next week.